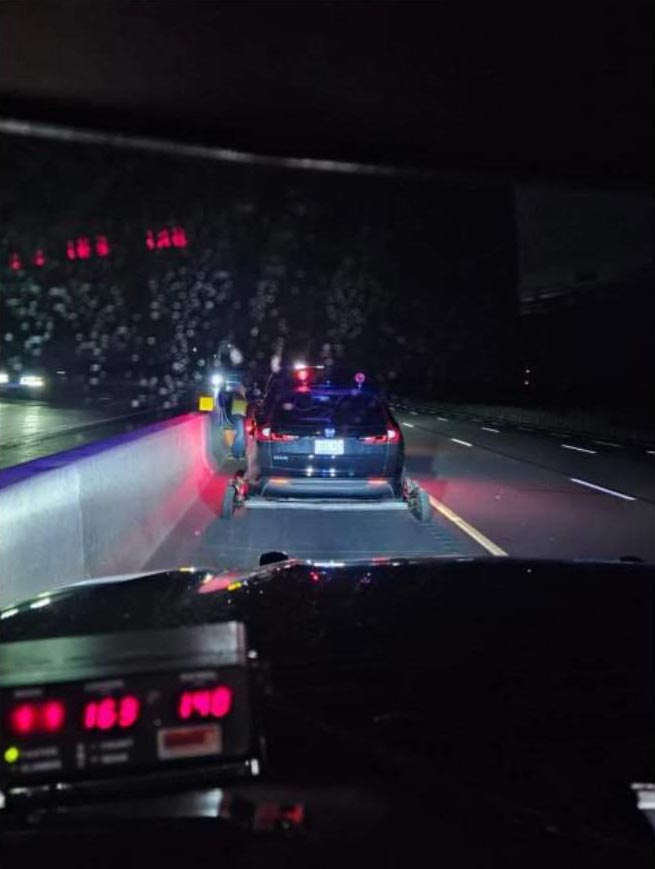
In 2025, the OPP continued to prioritize traffic enforcement targeting the “Big Four” causal factors in deaths and injuries on our roadways, trails, and waterways: speeding, lack of occupant restraints (seatbelts), distracted driving, and impaired driving.
Despite an 11% decrease over 2024, speeding charges continue to be the most regularly laid Big Four charge across the province. The largest percentage change organizationally was a 33% increase in distracted driving charges.
The OPP also continued to see an increase in seatbelt-related charges. Seatbelts play an essential role in keeping drivers and passengers safe and must be worn in accordance with the Highway Traffic Act.
| PROVINCIAL | 2023 | 2024 | 2025 | % change 2024 to 2025 |
|---|---|---|---|---|
| Speeding | 160,896 | 167,089 | 148,004 | -11% |
| Seatbelt | 9,973 | 13,179 | 13,560 | 3% |
| Distracted Driving | 4,092 | 4,303 | 5,732 | 33% |
| Impaired | 11,154 | 11,542 | 11,978 | 4% |
| Total | 186,115 | 196,113 | 179,274 | -9% |
Data retrieved from Niche RMS and eTicket on February 24, 2026.
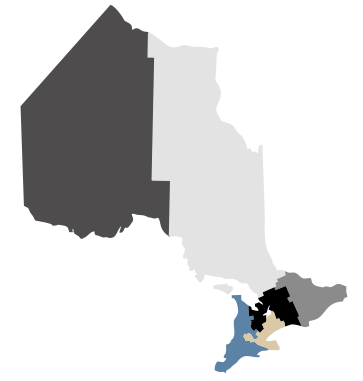
North East Region was the only region to not report an increase in distracted driving charges.
North West Region laid more charges across all Big Four categories than in 2024, though still fewer than 2023 overall.
West Region laid the highest number of Big Four charges in 2025 (42,984), despite seeing a decrease over 2024 (-9%).
Both North West Region and East Region saw an increase in total Big Four charges laid.
Central Region
laid the second most Big Four charges, however Central Region also had the largest decrease in charges laid when compared to 2024 (20% decrease).
View regional "Big Four" charges by selecting the  beside each location.
| 2023 | 2024 | 2025 | % change 2024 to 2025 |
|
|---|---|---|---|---|
| Speeding | 37,921 | 43,807 | 35,101 | -20% |
| Seatbelt | 2,435 | 4,121 | 2,754 | -33% |
| Distracted Driving | 864 | 873 | 890 | 2% |
| Impaired Driving | 2,247 | 2,426 | 2,374 | -2% |
| Total | 43,467 | 51,227 | 41,119 | -20% |
| 2023 | 2024 | 2025 | % change 2024 to 2025 |
|
|---|---|---|---|---|
| Speeding | 12,756 | 12,113 | 12,316 | 2% |
| Seatbelt | 660 | 651 | 676 | 4% |
| Distracted Driving | 352 | 135 | 244 | 81% |
| Impaired Driving | 1,184 | 1,353 | 1,453 | 7% |
| Total | 14,952 | 14,252 | 14,689 | 3% |
| 2023 | 2024 | 2025 | % change 2024 to 2025 |
|
|---|---|---|---|---|
| Speeding | 28,170 | 28,452 | 27,883 | -2% |
| Seatbelt | 1,664 | 1,778 | 2,241 | 26% |
| Distracted Driving | 674 | 815 | 1,290 | 58% |
| Impaired Driving | 2,243 | 2,102 | 2,254 | 7% |
| Total | 32,751 | 33,147 | 33,668 | 2% |
| 2023 | 2024 | 2025 | % change 2024 to 2025 |
|
|---|---|---|---|---|
| Speeding | 16,389 | 19,838 | 17,358 | -13% |
| Seatbelt | 561 | 690 | 709 | 3% |
| Distracted Driving | 180 | 249 | 217 | -13% |
| Impaired Driving | 1,080 | 1,317 | 1,412 | 7% |
| Total | 18,210 | 22,094 | 19,696 | -11% |
| 2023 | 2024 | 2025 | % change 2024 to 2025 |
|
|---|---|---|---|---|
| Speeding | 24,802 | 22,148 | 20,101 | -9% |
| Seatbelt | 2,821 | 2,805 | 3,309 | 18% |
| Distracted Driving | 1,337 | 1,561 | 2,067 | 32% |
| Impaired Driving | 1,627 | 1,602 | 1,631 | 2% |
| Total | 30,587 | 28,116 | 27,108 | -4% |
| 2023 | 2024 | 2025 | % change 2024 to 2025 |
|
|---|---|---|---|---|
| Speeding | 40,825 | 40,721 | 35,237 | -13% |
| Seatbelt | 1,831 | 3,134 | 3,871 | 24% |
| Distracted Driving | 683 | 667 | 1,022 | 53% |
| Impaired Driving | 2,773 | 2,740 | 2,854 | 4% |
| Total | 46,112 | 47,262 | 42,984 | -9% |
| Provincial | 2023 | 2024 | 2025 | % change 2024 to 2025 |
|---|---|---|---|---|
| Stunt/Racing | 5,447 | 5,996 | 5,326 | -11% |
| Liquor Licence Control Act - Traffic-Related | 2,369 | 2,571 | 2,729 | 6% |
| Cannabis Control Act - Traffic-Related | 2,520 | 2,842 | 2,793 | -2% |
| Compulsory Automobile Insurance Act | 22,535 | 25,817 | 28,359 | 10% |
| Off Road Vehicles Act | 795 | 762 | 852 | 12% |
| Canada Shipping Act | 1,366 | 1,227 | 1,242 | 1% |
| Motorized Snow Vehicle Act | 802 | 521 | 931 | 79% |
| Other Provincial Traffic | 128,257 | 144,717 | 154,380 | 7% |
| Other Criminal Code Traffic | 4,351 | 4,848 | 5,278 | 9% |
| Total | 168,472 | 189,301 | 201,890 | 7% |
Data retrieved from Niche RMS and eTicket on February 24, 2026.
| 2023 | 2024 | 2025 | ||||
|---|---|---|---|---|---|---|
| Traffic Stop | Traffic Enforcement Stop | Traffic Stop | Traffic Enforcement Stop | Traffic Stop | Traffic Enforcement Stop | |
| Central Region | 88,121 | 4,451 | 100,000 | 6,748 | 88,038 | 7,312 |
| North West Region | 34,754 | 1,647 | 31,566 | 1,549 | 31,777 | 1,702 |
| East Region | 64,603 | 4,427 | 64,192 | 6,598 | 71,190 | 9,579 |
| North East Region | 52,472 | 2,508 | 54,688 | 2,780 | 54,409 | 3,833 |
| Highway Safety Division | 61,377 | 7,864 | 58,118 | 7,484 | 56,745 | 9,582 |
| West Region | 104,100 | 9,101 | 103,075 | 10,493 | 105,237 | 10,966 |
| General Headquarters | 11,498 | 130 | 10,047 | 218 | 8,999 | 227 |
| Total | 416,979 | 30,136 | 421,959 | 35,887 | 416,654 | 43,225 |
Data source: Computer-Aided Dispatch.
Date: February 24, 2026
| 2023 | 2024 | 2025 | % change 2024 to 2025 | |
|---|---|---|---|---|
| Central Region | 8,357 | 10,155 | 9,944 | -2% |
| North West Region | 7,232 | 6,756 | 7,397 | 9% |
| East Region | 6,002 | 6,319 | 7,397 | 17% |
| North East Region | 5,045 | 5,360 | 6,485 | 21% |
| Highway Safety Division | 2,283 | 2,035 | 2,781 | 37% |
| West Region | 11,115 | 12,446 | 15,553 | 25% |
| TOTAL | 40,034 | 43,071 | 49,557 | 15% |
Data source: Niche RMS
Date: February 24, 2026
THE OPP
INCREASED THE NUMBER OF
REDUCE IMPAIRED DRIVING EVERYWHERE (RIDE) EVENTS BY 15% IN 2025
OVER 2024.
Overall, the OPP saw a decrease in collisions in 2025 over 2024 (-7%) and a decrease or no change in fatal collisions across all categories except motorized snow vehicles, which saw a 113% increase (8 fatal collisions in 2024, 17 fatal collisions in 2025).
| PROVINCIAL | 2023 | 2024 | 2025 | % change 2024 to 2025 | |
|---|---|---|---|---|---|
| Roadway | Fatal Collisions | 369 | 343 | 300 | -13% |
| Personal Injury Collisions | 8,180 | 8,185 | 8,116 | -1% | |
| Property Damage Collisions | 68,537 | 71,578 | 66,214 | -7% | |
| Total | 77,086 | 80,106 | 74,630 | -7% | |
| Off-Road Vehicle | Fatal Collisions | 25 | 34 | 21 | -38% |
| Personal Injury Collisions | 226 | 258 | 227 | -12% | |
| Property Damage Collisions | 84 | 70 | 73 | 4% | |
| Total | 335 | 362 | 321 | -11% | |
| Marine Vessel | Fatal Collisions | 25 | 17 | 17 | 0% |
| Personal Injury Collisions | 25 | 18 | 28 | 56% | |
| Property Damage Collisions | 11 | 17 | 13 | -24% | |
| Total | 61 | 52 | 58 | 12% | |
| Motorized Snow Vehicles | Fatal Collisions | 14 | 8 | 17 | 113% |
| Personal Injury Collisions | 89 | 45 | 106 | 136% | |
| Property Damage Collisions | 57 | 35 | 56 | 60% | |
| Total | 160 | 88 | 179 | 103% | |
| All Collisions Total | 77,642 | 80,608 | 75,188 | -7% |
Data source: Electronic Collision Reporting System (eCRS)
Date: February 24, 2026
| ROADWAYS |
CR
Central Region |
NWR
North West Region |
ER
East Region |
NER
North East Region |
HSD
Highway Safety Division |
WR
West Region |
Total |
|---|---|---|---|---|---|---|---|
| Number of Fatal Collisions | 57 | 21 | 50 | 38 | 42 | 92 | 300 |
| Persons Killed | 64 | 28 | 57 | 44 | 46 | 105 | 344 |
| Persons Killed - Alcohol/Drug - related | 5 | 2 | 13 | 1 | 0 | 13 | 34 |
| OFF-ROAD VEHICLE |
CR
Central Region |
NWR
North West Region |
ER
East Region |
NER
North East Region |
HSD
Highway Safety Division |
WR
West Region |
Total |
|---|---|---|---|---|---|---|---|
| Number of Fatal Collisions | 3 | 1 | 8 | 5 | 0 | 4 | 21 |
| Persons Killed | 3 | 1 | 8 | 8 | 0 | 4 | 24 |
| Persons Killed - Alcohol/Drug - related | 1 | 0 | 2 | 6 | 0 | 3 | 12 |
| MARINE VESSELS |
CR
Central Region |
NWR
North West Region |
ER
East Region |
NER
North East Region |
HSD
Highway Safety Division |
WR
West Region |
Total |
|---|---|---|---|---|---|---|---|
| Number of Fatal Collisions | 3 | 0 | 6 | 4 | 0 | 4 | 17 |
| Persons Killed | 4 | 0 | 6 | 4 | 0 | 5 | 19 |
| Persons Killed - Alcohol/Drug - related | 1 | 0 | 2 | 1 | 0 | 2 | 6 |
| MOTORIZED SNOW VEHICLES |
CR
Central Region |
NWR
North West Region |
ER
East Region |
NER
North East Region |
HSD
Highway Safety Division |
WR
West Region |
Total |
|---|---|---|---|---|---|---|---|
| Number of Fatal Collisions | 4 | 1 | 0 | 7 | 0 | 5 | 17 |
| Persons Killed | 4 | 1 | 0 | 7 | 0 | 5 | 17 |
| Persons Killed - Alcohol/Drug - related | 0 | 1 | 0 | 1 | 0 | 3 | 5 |
Data source: Electronic Collision Reporting System (eCRS)
Date: February 24, 2026
The OPP attended a similar number of commercial motor vehicle (CMV) involved collisions in 2025 compared to 2024 (+5 collisions), however CMV involved collisions resulted in the most fatal collisions of all types reported in 2025 (26% of all fatal collisions). After an almost 45% increase in motorcycle involved fatal collisions in 2024, the OPP saw a 15% decrease in 2025. While there was an increase in speed-related collisions (12%), there was a decrease in speed-related fatal collisions (-24%).
| ROADWAYS - PROVINCIAL | 2023 | 2024 | 2025 | |
|---|---|---|---|---|
| CMV Involved | Fatal Collisions | 87 | 72 | 77 |
| Personal Injury Collisions | 968 | 906 | 935 | |
| Property Damage Collisions | 7,569 | 7,843 | 7,814 | |
| Total | 8,624 | 8,821 | 8,826 | |
| Motorcycle Involved | Fatal Collisions | 38 | 55 | 47 |
| Personal Injury Collisions | 79 | 536 | 486 | |
| Property Damage Collisions | 302 | 394 | 277 | |
| Total | 819 | 985 | 810 | |
| Animal Related | Fatal Collisions | 6 | 4 | 2 |
| Personal Injury Collisions | 374 | 355 | 331 | |
| Property Damage Collisions | 11,236 | 12,317 | 9,333 | |
| Total | 11,616 | 12,317 | 9,666 | |
| Inattentive Related | Fatal Collisions | 52 | 69 | 44 |
| Personal Injury Collisions | 1,097 | 1,026 | 921 | |
| Property Damage Collisions | 6,431 | 5,934 | 5,041 | |
| Total | 7,580 | 7,029 | 6,006 | |
| Speed Related | Fatal Collisions | 79 | 85 | 65 |
| Personal Injury Collisions | 1,603 | 1,518 | 1,600 | |
| Property Damage Collisions | 7,495 | 7,262 | 8,268 | |
| Total | 9,177 | 8,865 | 9,933 | |
| Alcohol/Drug Related | Fatal Collisions | 59 | 51 | 31 |
| Personal Injury Collisions | 643 | 630 | 584 | |
| Property Damage Collisions | 1,843 | 1,890 | 1,722 | |
| Total | 2,545 | 2,571 | 2,337 |
Data source: Electronic Collision Reporting System (eCRS)
Date: February 24, 2026
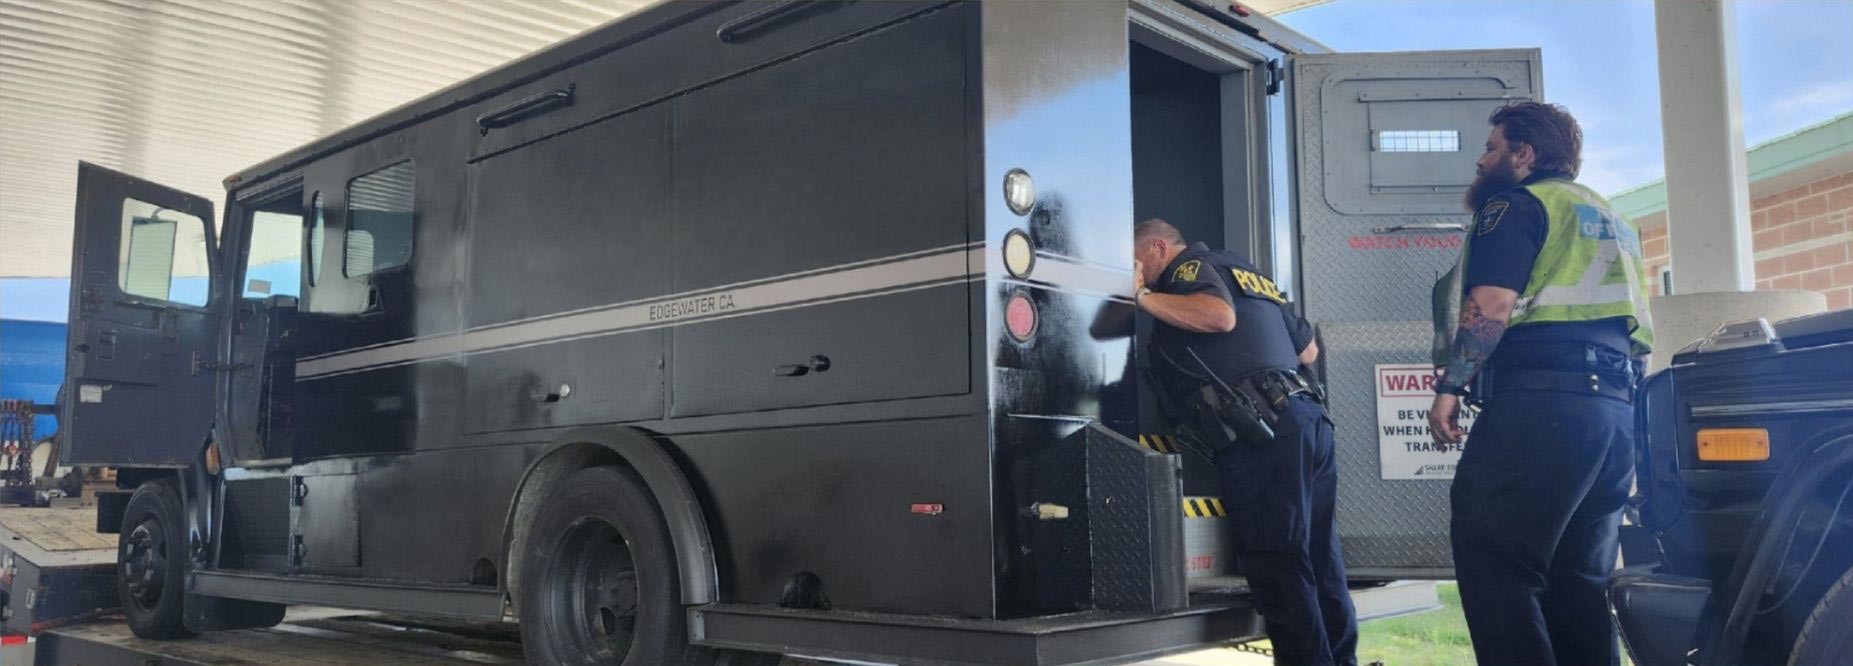
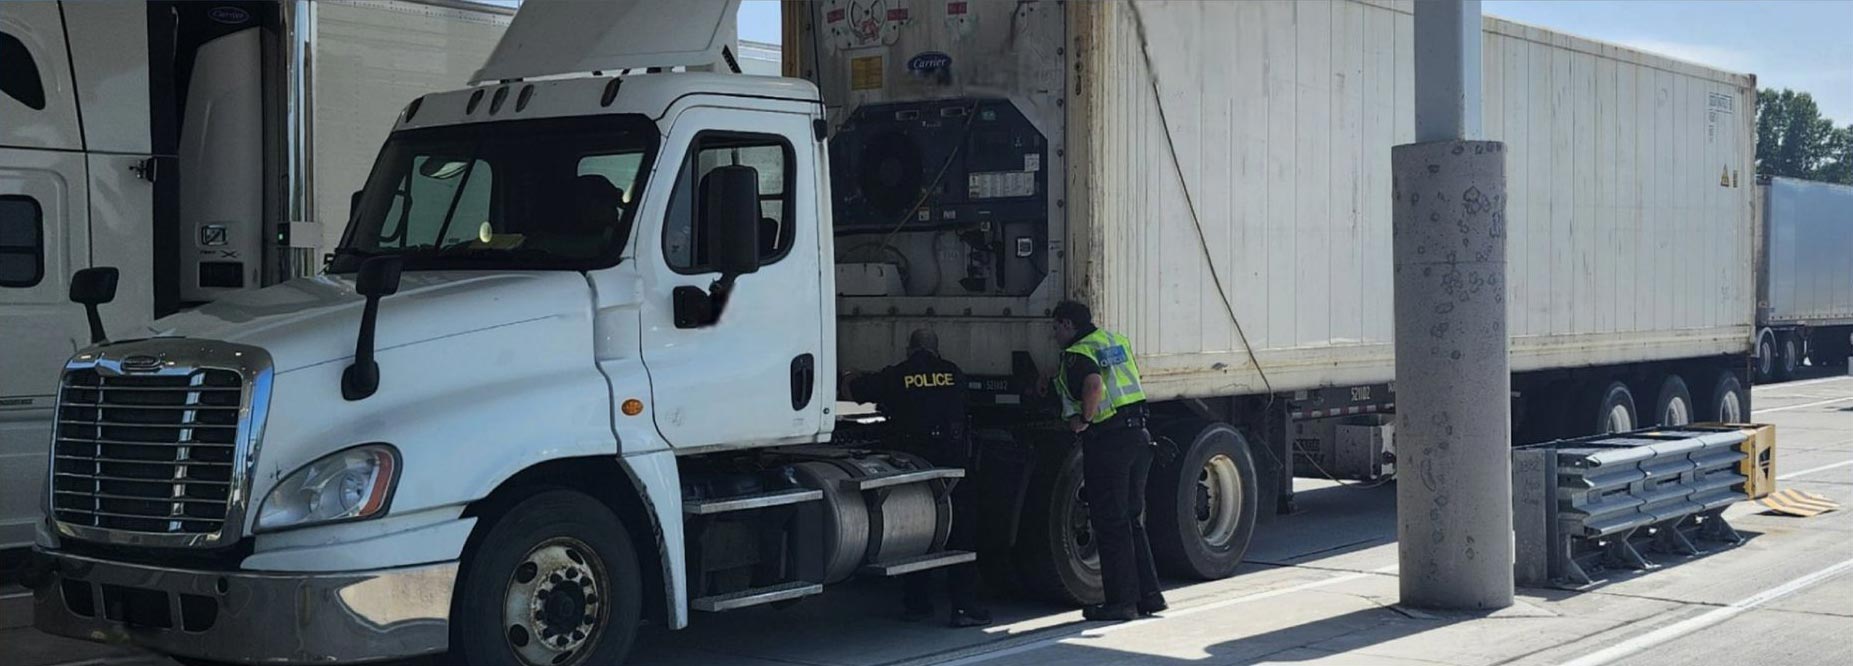
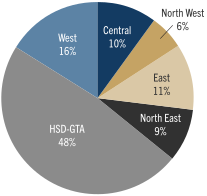
The OPP continues to prioritize commercial motor vehicle (CMV) related enforcement. There was an 18% decrease in Big Four charges laid against CMV drivers in 2025 over 2024, however, similarly to Big Four charges in general, there was increase in distracted driving charges laid (27%). In 2025:
Data source: Electronic Collision Reporting System (eCRS)
Date: February 24, 2026